Selected work

Ten projects, and you can open every one of them.


Two live client sites you can use, and eight repositories you can read. Nothing here is a mockup or a tutorial follow-along.

What’s on this page

Projects shown
10
Live client sites
02
Public repositories
08
Applied modelling
03

Web & product engineering

Applications people actually use.

A bookstore checkout, a resort booking flow, and a charting tool. All three are running right now.

The Aristoc Booklex online bookstore storefrontFull-Stack E-commerce

Aristoc Booklex

A collaboration on the online storefront for an established Ugandan bookstore chain, and one where I worked across the full stack: catalogue browsing and search, customer accounts, wishlist, cart, and checkout with delivery or in-store pickup, built as a React application against a token-secured API. The platform is live and still in active development.

  • React
  • REST API
  • Authentication
  • Payments
Analytics dashboard on a laptop displayTime-series Visualisation

Stock Market Visualizer

An interactive web project for acquiring and charting time-series stock market data through a focused visual interface.

  • HTML
  • Time series
  • Data visualisation
The Streamside Park homepage with its booking availability panelHospitality Booking Platform

The Streamside Park

A collaboration on the booking site for a nature resort in Buwate, Wakiso: accommodation, dining, events and activities, with a date-and-guest availability search on the landing page and WhatsApp enquiry built into every screen. A React single-page application bundled with Vite, served over nginx.

  • React
  • Vite
  • Booking flow
  • Responsive UI

Data engineering & analytics

Quality, analysis, and reporting projects.

Projects that organise, assess, analyse, or communicate data.

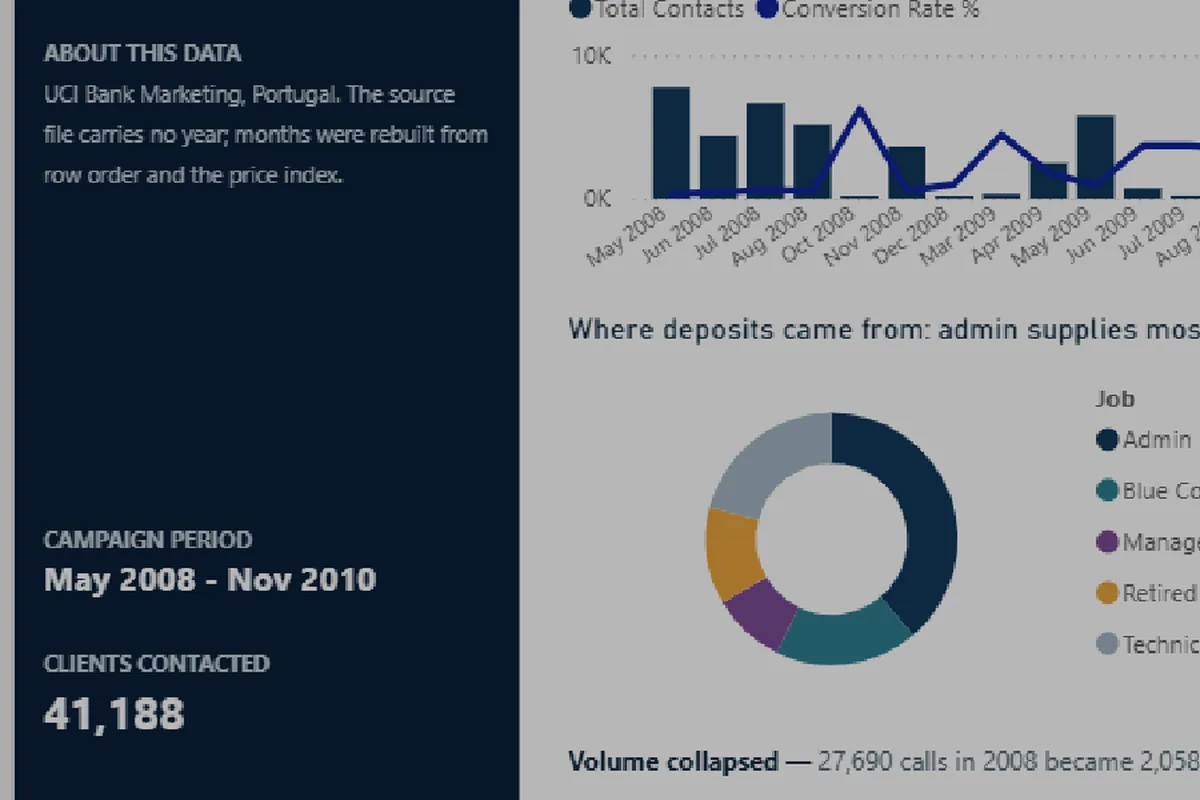
Power BI executive overview page for the bank marketing campaign reportPower BI

Bank Marketing Campaign Report

A five-page Power BI report over 41,188 telemarketing contacts, showing a bank that cut 93% of its calls and lost only 20% of its deposits — a 10.8x lift in conversion. The source file carries no year, so the campaign calendar is rebuilt in Power Query from row order and the consumer price index. Authored in PBIP format, so the model and every visual stay reviewable as plain text.

  • Power BI
  • Power Query
  • DAX
  • Data modelling
Data charts displayed on a computer screenData Engineering

Data Quality Assessment Tool

A Python toolkit for automated dataset profiling, with checks for missing values, outliers, and inconsistent records.

  • Python
  • Data quality
  • Profiling
  • MIT License
Stock market chart displayed on a monitorFinancial Analysis

Tesla & GameStop Financial Analysis

A Python analysis that extracts and visualises stock data to examine company performance and market trends.

  • Python
  • yfinance
  • Financial data
Financial documents and laptop prepared for analysisExploratory Analysis

Healthcare Cost Analysis

Exploratory analysis of medical insurance data to examine cost drivers and demographic patterns in expenditure.

  • Jupyter
  • EDA
  • Healthcare economics

Applied machine learning

Classification and prediction projects.

Projects demonstrating dataset preparation, modelling workflows, and domain-specific problem framing.

Laboratory researcher working with medical samplesComputer Vision

Pneumonia Detection

A convolutional neural-network project that classifies chest X-ray images for pneumonia detection.

  • Deep learning
  • CNN
  • Healthcare
Modern residential property exteriorRegression

House Price Prediction

A machine-learning project using the King County dataset to model residential property prices.

  • Jupyter
  • Regression
  • Real estate
Business analytics charts on a laptopClassification

Customer Churn Prediction

A classification workflow for identifying customers who may be at risk of leaving, supporting retention analysis.

  • Jupyter
  • Classification
  • CRM

How to review the work

Follow the evidence to the repository.

The project page stays concise; source code and repository documentation remain the primary evidence.

Problem

Start with the repository description and the real-world question the project is framed around.

Method

Review data preparation, analysis or modelling choices, dependencies, and documented assumptions.

Output

Inspect notebooks, scripts, visualisations, and available live demos without relying on unsupported claims.

Have a similar problem to solve?

Share the users, the data behind it, and the result you want to make repeatable.

Start a conversation